
This newsletter highlights some of what we do in the background to ensure scientifically sound diets that are grounded in practicality, and are cost effective. Believe it or not the idea for writing on this got started about 4 years ago. Jason and I were hired by a client to go look at a facility that was for sale. Jason’s comment about the feeding area was interesting. “Just feed one pound of every commodity and diets will be fine.” There were 16 commodity bays! More on that in a moment.
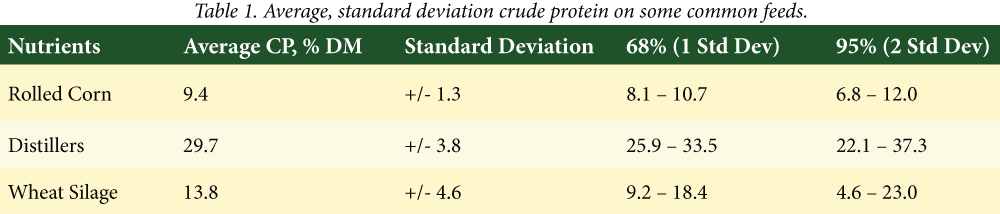
We need to begin with a math lesson on average and standard deviation. Take 10 samples of rolled corn, analyze for protein, add the results, divide by 10 = average. The average is used for diet formulation with high confidence. Take 10 samples of distillers (wet or dry), analyze for protein, add the results, divide by 10 = average. Use the average for diet formulation and you might be right. The difference in how we interpret the average is standard deviation. Think of standard deviation as measuring the level of confidence you should have in the average being right. Table 1 shows protein, standard deviation of protein, and the impact that standard deviation has on range of expected values.
Interpretation of table 1 is pretty straight forward. The average crude protein (CP) for rolled corn +/- its standard deviation means that 68% of the time it will be between 8.1 and 10.7%. And 95% of the time it will be from 6.8 to 12.0% crude protein. Corn as a grain is very consistent and requires few samples for formulation. Therefore, using book value based on 1,000s of samples or laboratory supplied average within a given year is acceptable for formulation. Distillers (wet or dry) grains are more variable, as evidenced by the higher standard deviation. With this higher variation (less confidence) using book values likely results in high probability that diet formulation is wrong. There are two common ways to control the impact of a variable ingredient on the diet. Make the assumption that the protein is somewhat lower than the average when formulating the diet. This margin of error forces over formulation of protein to add confidence that protein is not limited. The second option (alone or with the first one) is to minimize the feed rate of distillers to reduce its impact in the diet.
If we look at the interaction of cost and impact on the diet the concept becomes clearer. If not, blame the author and have your lead consultant explain it. We compared rolled corn at 10 lbs or distillers at 4 lbs. Holding one or the other constant for protein and plugging in the 68% confidence range changed the protein in the diet exactly the same. This indicates that the impact of a low variable feed at high rate (rolled corn) will impact the diet to a similar extent as a low feed rate ingredient with a high variation (distillers).
We included wheat silage in the table to represent forages. As you know forages are the most variable ingredient due to countless factors and therefore require more sampling to improve confidence that we are not using the WRONG value.
In 2007, Weiss and St-Pierre, presented at the Western Dairy Management Conference on this topic. Five key points from the paper are: We use all of these points in our diet formulations, illustrated by the notes in italic print.
- Feeds with large variation in nutrient composition are worth less than feeds with less variation.
- The impact of variation in nutrient composition of a feedstuff is reduced when diets contain a wide variety of different ingredient.
- An ingredient may look great as a single item. But when we examine it in relation to points 1 and 2, it may not fit. We may need a low variation feed that adds a few cents per head daily to make the diet better.
- Remember the quote from Jason? Point 2 gets at the science of why feeding one pound of 16 commodities is probably a pretty good nutritional concept. You have probably heard us talk about wanting to introduce a complimentary ingredient to the diet. This is often necessary when feeding corn silage, rolled corn, corn distillers, and corn gluten. A non-corn ingredient will be complimentary and help the diet/rumen/cow.
- …but the mean of two numbers has the lowest probability of being substantially wrong.
- The average of a normal distribution is not the absolute “right” answer, but it is the value that has the lowest probability of being substantially wrong.
- Points 3 and 4 may appear defensive, or a poor approach. But we avoid “being wrong” by monitoring variation, evaluating ingredients not just by themselves but how they impact the diet/rumen/cow, and over-formulating nutrients when appropriate.
- Feeds with low expected variability (ex. Corn grain, soybean meal, whole cottonseed) do not have to be analyzed routinely and in some cases not at all.
- When we sample standard commodities we are usually looking at moisture or investigating a problem. For formulating diets we rely on book values with low standard deviations, or current laboratory results from a given crop year.
In conclusion, building diets is not about ingredient costs, or protein content, or cost per unit of protein. It is about all of that, and more.
Table 1. Average, standard deviation crude protein on some common feeds.
Announcements
Anthony Alamo will be joining the DairyWorks team in June following graduation from Cal Poly, San Luis Obispo with a Bacherlor of Science degree in Dairy Science and a Minor in Agribusiness. Anthony is from Modesto, CA and is a fourth generation family member of Alamo Dairy Farms.
Chelsea Schossow has accepted a summer intern position with Pine Creek Nutrition Service, Inc. Chelsea is a student at South Dakota State Univer- sity and is expected to graduate in May 2017 with a Bachelor of Dairy Science Production and Agribusiness degree.